Development of data visualization service to provide analytics and insights about the properties of computing jobs.
Tasks
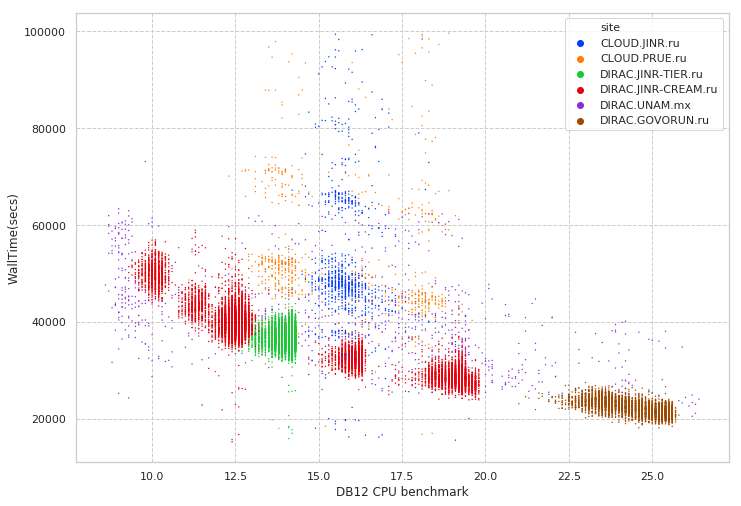
1. Initial review and analysis of the raw data.
2. Setting up data storage.
3. Setting up a web server.
4. Development of web-pages.
5. Development of data visualization modules.
Preliminary schedule by topics/tasks
The duration of this project is 6 weeks.
Required skills
- JavaScript - most of the work will be there.
- JS libraries for charts: Highcharts, or similar. D3 is an advantage.
- Basics knowledge of any DBMS.
- Python
- Linux
Acquired skills and experience
- You will improve and apply the skills required for the project
- You will probably learn what REST, Apache, influxDB, virtualization is
- You will be able to include completed project to your portfolio
Recommended literature
Online tutorials on highcharts (JS), Flask(Python).
Online tutorials on D3 is advantage.